
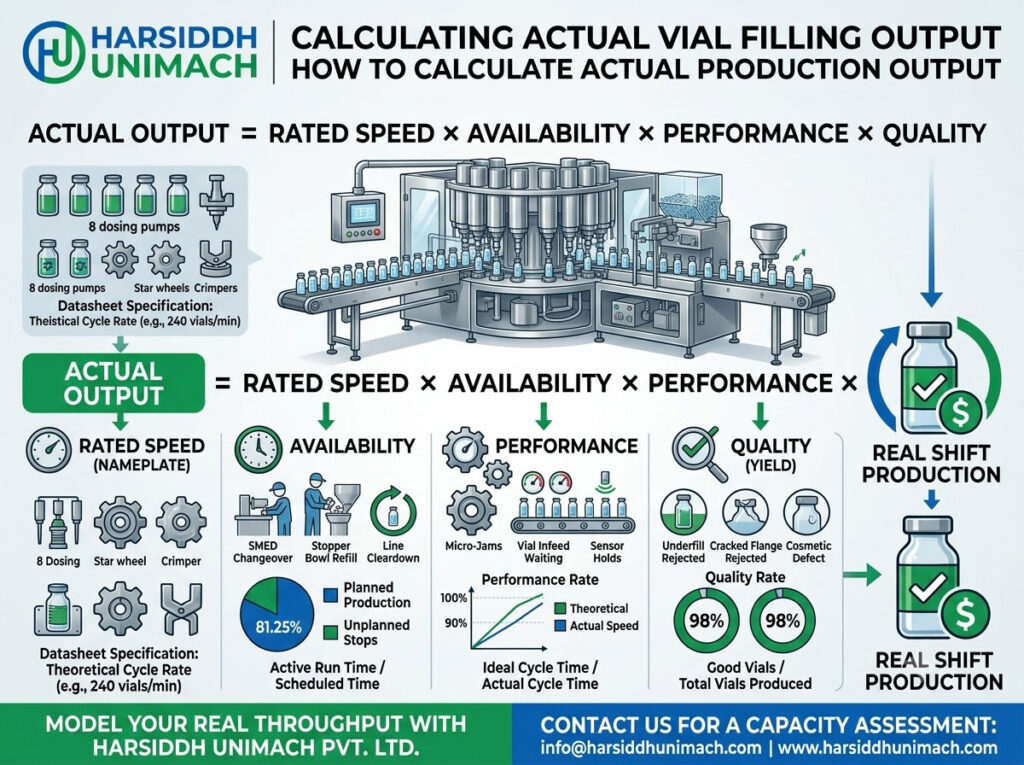
A vial filling machine may be rated at 120 vials per minute. Multiply that by 60 minutes and 8 hours and you might expect 57,600 vials per shift. Yet at the end of the shift, the count is often much lower. Where did the difference go?
The answer lies in the gap between rated speed and actual output. Rated speed is what the machine can do under ideal conditions. Actual output is what the line delivers once breaks, changeovers, stops, slow running and rejects are taken into account. Understanding and measuring that gap is essential for realistic production planning, capacity decisions and improvement work.
This article explains how to calculate the actual production output of a vial filling line. It covers the key time and loss categories, a step-by-step worked example using Overall Equipment Effectiveness (OEE), how to find the bottleneck machine and practical ways to close the gap.
If you are sizing a new machine from demand, see our technical guide to sizing and selecting a filling machine. This article focuses on measuring and understanding the output of a line that is already running.
All numbers in this article are illustrative examples to show how the calculations work. They are not performance data for any specific machine.
Rated Speed vs Actual Output
| Term | Meaning |
|---|---|
| Rated (nameplate) speed | Maximum speed the machine is designed for, usually under ideal conditions |
| Set speed | Speed the line is actually set to run for a given product and format |
| Actual running speed | Average speed while the line is running, including slowdowns |
| Actual output | Total good vials produced in a period |
Rated speed is useful for comparing machines, but it rarely reflects real production. Set speed may be lower than rated speed because of the product, vial size or fill volume. Actual output is lower still because of stops, slowdowns and rejects.
Why Actual Output Is Lower Than Rated Speed
Losses fall into three groups:
1. Availability Losses: The Line Is Not Running
- planned breaks, if they fall inside planned production time
- changeovers and cleaning
- breakdowns
- waiting for materials, operators or QA release
- start-up time
2. Performance Losses: The Line Runs Slower Than Ideal
- running below rated speed because of product or format
- minor stops (short jams and resets)
- slowdowns caused by upstream or downstream machines
3. Quality Losses: Output That Is Not Good
- rejected vials (fill, stopper, cap, inspection)
- start-up rejects
- vials removed after interventions
OEE combines all three into one measure.
The OEE Formula
OEE = Availability × Performance × Quality
- Availability = Run time ÷ Planned production time
- Performance = Actual vials produced ÷ (Run time × Ideal speed)
- Quality = Good vials ÷ Actual vials produced
Good output = Planned production time × Ideal speed × OEE
Worked Example: Calculating Actual Output for One Shift
Consider a vial filling line with an ideal (rated) speed of 120 vials per minute.
Step 1: Define Shift and Planned Production Time
- Shift length: 8 hours = 480 minutes
- Planned breaks: 30 minutes
- Planned production time: 480 − 30 = 450 minutes
Step 2: Subtract Downtime to Get Run Time
- Changeover at start of shift: 40 minutes
- Stops (breakdowns and longer jams): 35 minutes
- Run time: 450 − 40 − 35 = 375 minutes
Availability = 375 ÷ 450 = 83.3%
Step 3: Compare Actual Count With Ideal Count
- Ideal count in run time: 375 × 120 = 45,000 vials
- Actual count from the machine counter: 40,500 vials
Performance = 40,500 ÷ 45,000 = 90%
The 10% performance loss comes from minor stops and running below rated speed.
Step 4: Account for Rejects
- Rejected vials: 810
- Good vials: 40,500 − 810 = 39,690
Quality = 39,690 ÷ 40,500 = 98%
Step 5: Calculate OEE
OEE = 0.833 × 0.90 × 0.98 ≈ 73.5%
Step 6: Express Actual Output
- Good vials per shift: 39,690
- Good vials per planned hour: 39,690 ÷ 7.5 = 5,292
- Effective speed over planned time: 39,690 ÷ 450 ≈ 88 vials per minute
So although the machine is rated at 120 vials per minute, the line effectively delivered about 88 good vials per minute of planned production time in this example. Using rated speed for planning would have overestimated output by more than a third.
| Measure | Value |
|---|---|
| Rated speed | 120 vials/min |
| Planned production time | 450 min |
| Run time | 375 min |
| Availability | 83.3% |
| Performance | 90% |
| Quality | 98% |
| OEE | 73.5% |
| Good vials | 39,690 |
| Effective speed | ~88 vials/min |
The Line Is Only as Fast as Its Slowest Machine
A vial line includes several machines: washer, tunnel, filler and stopperer, cap sealer, external washer, inspection and labeller. The line’s output is limited by the bottleneck, the slowest machine at any moment.
Illustrative example of set speeds:
| Machine | Set Speed (vials/min) |
|---|---|
| Vial washer | 150 |
| Depyrogenation tunnel | 130 |
| Filling and stoppering machine | 120 |
| Cap sealing machine | 140 |
| Labeller | 150 |
Here the filler, at 120 vials per minute, is the bottleneck, which is usually intended: upstream and downstream machines run faster so the filler is never starved or blocked. If the cap sealer were set to 110 vials per minute, it would become the bottleneck and the whole line would be limited to that speed.
Typical machines in a vial line include an automatic linear vial washer or a linear vial washer, a sterilizing tunnel for ampoules and vials, a filler such as a six head liquid vial filling and stoppering machine or a liquid vial filling machine with rubber stoppering, and a cap sealer such as an automatic eight head vial cap sealing machine or a vial cap sealing machine with 1, 4, 6 or 8 heads. Downstream, an automatic external vial washing machine, a visual ampoule and vial inspection machine and a vertical vial sticker labeller complete the line.
How to Find the Bottleneck
- Compare set speeds of all machines for the current format.
- Observe where vials accumulate (upstream of the bottleneck) and where gaps appear (downstream).
- Record which machine causes most stops and slowdowns.
- Check whether the bottleneck changes with vial size or product.
How Format and Product Affect Speed
The same line may run at different speeds for different products and vial sizes:
- Larger fill volumes take longer to dispense.
- Viscous or foaming products need slower fill profiles.
- Very small vials can be less stable at high speed.
- Partial stoppering for lyophilised products may require slower handling.
Calculate actual output separately for each major product and format, rather than using one figure for the whole line.
Collecting the Right Data
Accurate output calculation depends on good data:
- Planned production time from the shift schedule
- Downtime recorded by reason and duration (changeovers, breakdowns, waiting)
- Machine counters for total vials processed
- Reject counts by type
- Good output from final counts or batch reconciliation
Many modern machines record counts and alarms automatically. Where data is recorded manually, use simple, consistent forms.
Using Output Data to Improve
Once you know where output is lost, you can target improvements:
| Loss Area | Improvement Ideas |
|---|---|
| Changeovers | Preparation outside the stop, marked parts, recipes |
| Breakdowns | Preventive maintenance, spare parts, root cause analysis |
| Minor stops | Fix jams at transfers, improve vial quality, adjust guides |
| Slow running | Optimise fill profiles, check bottleneck speeds |
| Rejects | Improve fill accuracy, stoppering and capping consistency |
Our articles on vial filling machine changeover best practices, common causes of downtime in pharmaceutical filling lines and minimising product loss during high-speed production explain these improvements in more detail.
From Shift Output to Weekly and Annual Capacity
Shift calculations become much more useful when rolled up over longer periods. To estimate weekly or annual capacity:
- Calculate OEE for a representative number of shifts, covering different products and formats.
- Use the average OEE, not the best shift, for planning.
- Multiply planned production time per week by ideal speed and average OEE.
- Adjust for planned maintenance shutdowns, holidays and validation activities.
Track OEE weekly so trends become visible. A gradual decline may point to wear, rising changeover frequency or new product mix, while a step change usually follows a specific event, such as a new product, a component change or an equipment modification.
How Machine Design Influences Actual Output
Two lines with the same rated speed can deliver very different actual output. Design features that protect real output include quick-change parts and recipes that shorten changeovers, reliable vial handling that reduces minor stops, accurate dosing that cuts rejects and clear diagnostics that speed recovery from faults. Servo-driven fillers are particularly strong on the last three points, as explained in our article on how servo-driven vial filling systems outperform mechanical lines.
Should You Run Faster?
Increasing set speed seems like the quickest way to increase output, but it can backfire. At higher speeds, foaming, splashing, breakage, minor stops and rejects may increase, reducing availability and quality. The goal is the speed that delivers the most good vials per planned hour, not the highest number on the speed dial.
Before increasing speed:
- Confirm that fill accuracy and stoppering remain within limits.
- Check that upstream and downstream machines can keep up.
- Monitor reject rates and minor stops after the change.
- Compare good output per planned hour before and after.
Using Actual Output for Planning and Investment
Actual output figures, not rated speeds, should drive:
- production planning: realistic batch schedules and delivery dates
- capacity planning: whether current lines can meet future demand
- investment decisions: whether to improve the existing line, add shifts or buy additional capacity
If actual output consistently falls short of demand, compare the cost of improving OEE with the cost of new equipment. Our article comparing small vial machines and high-speed vial lines can help with capacity decisions. An integrated automatic liquid vial filling line with matched speeds can reduce transfer losses, while for powders, a double wheel injectable dry powder filling machine with vial rubber stoppering offers higher output than single-wheel designs.
Quick Output Calculation Template
| Item | Your Value |
|---|---|
| Shift length (min) | |
| Planned breaks (min) | |
| Planned production time (min) | |
| Downtime (min) | |
| Run time (min) | |
| Ideal speed (vials/min) | |
| Actual count | |
| Rejects | |
| Good vials | |
| Availability (%) | |
| Performance (%) | |
| Quality (%) | |
| OEE (%) | |
| Effective speed (good vials/min of planned time) |
Frequently Asked Questions
Why is my actual output so much lower than the rated speed? Changeovers, stops, slow running and rejects all reduce output. OEE shows how much each contributes.
What is a good OEE for a vial filling line? It varies widely with product mix, batch sizes and changeover frequency. The most useful benchmark is your own trend over time.
Should planned breaks be included in planned production time? Definitions vary. Choose one approach, document it and apply it consistently so results are comparable.
How do I know which machine limits output? Compare set speeds, observe where vials accumulate and record which machine causes most stops.
Does a faster filler always increase output? Only if the rest of the line can keep up and quality holds.
Get More Real Output From Your Vial Line With Harsiddh
Harsiddh Unimach manufactures vial washers, sterilising tunnels, filling and stoppering machines, cap sealers, external washers, inspection machines and labellers designed to work together at matched speeds. Our team can help you analyse your line’s actual output and identify where improvements will make the biggest difference.
Contact us through our contact page or send your requirements through our inquiry form.