
When a pharmaceutical manufacturer buys a vial filling machine, the number that usually gets circled on the spec sheet is the top-line speed: “150 vials per minute,” “240 vials per minute,” and so on. It’s the number sales teams lead with, and the number production planners use to forecast batch schedules. It is also, almost without exception, not the number a plant actually achieves over a full shift.
Nameplate speed is a mechanical ceiling — the rate at which the machine’s dosing heads, star wheels, and crimping stations can theoretically cycle under ideal conditions. Real production output is something else entirely: a function of nameplate speed, machine availability, product-specific derating, changeover frequency, and the inevitable micro-stops that come from running a sterile, multi-station line for eight or twelve hours straight.
For production engineers, plant managers, and anyone building a capacity model or a batch record schedule, understanding the gap between “rated speed” and “actual output” is the difference between a production plan that works and one that quietly falls behind every single shift. This guide walks through exactly how to calculate real-world throughput for a vial filling machine, station by station, factor by factor.
Why Nameplate Speed Is Only the Starting Point
A machine rated at 150 vials per minute is describing its instantaneous mechanical cycle rate — how fast the indexing mechanism, dosing pumps, and star wheels can move when everything is running, every vial is present, and no adjustment, cleaning, or format change is happening.
In practice, a filling line spends part of every shift not filling vials at all. It’s waiting for the next batch of stoppers to load into the vibratory bowl, pausing while an operator clears a jammed vial at the infeed, sitting idle during a scheduled in-process check, or slowing down because a slightly out-of-tolerance vial batch is causing more “no vial – no fill” holds than usual. None of this shows up on the spec sheet, but all of it shows up on the shift report.
This is precisely why understanding the vial filling machine’s working principle and process flow matters before you try to model its output — every station in that flow (infeed, pre-gassing, dosing, post-gassing, stoppering, crimping, outfeed) is a potential source of both mechanical cycle time and unplanned stoppage.
The Core Formula: From Rated Speed to Real Output
The starting point for any capacity calculation is the standard overall equipment effectiveness (OEE) framework, adapted for a filling line:
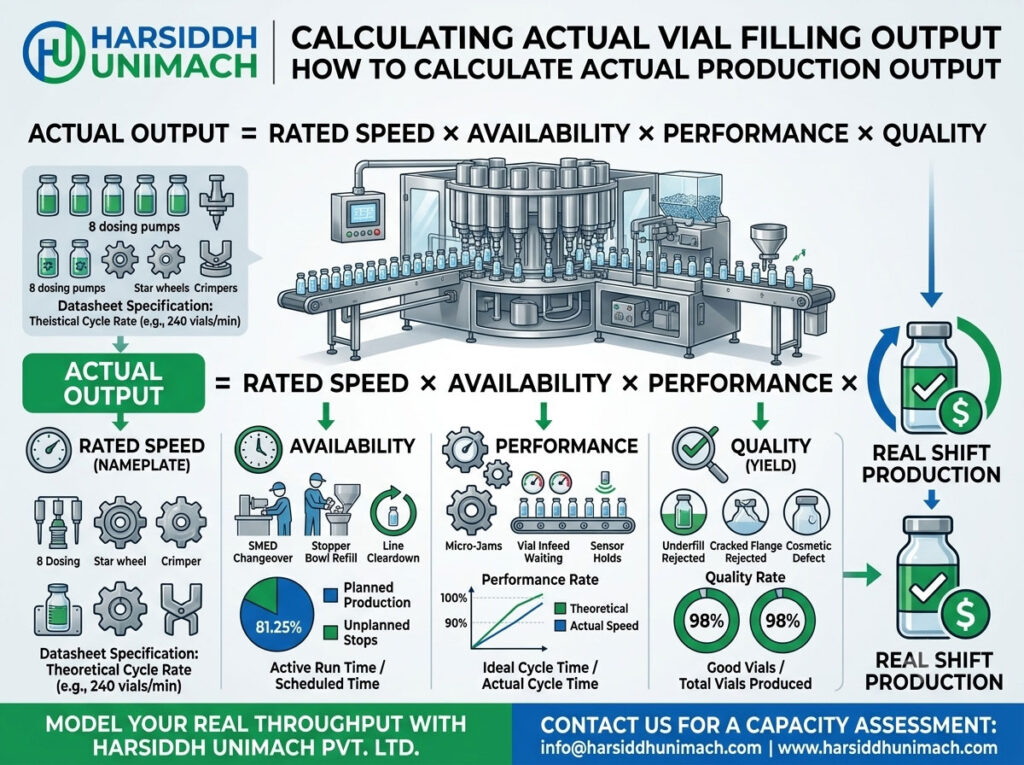
Actual Output = Rated Speed × Availability × Performance Rate × Quality Rate
Let’s break down what each of those four terms actually means on a vial line.
1. Rated Speed (the nameplate number)
This is the number from the technical datasheet — for example, an 8-head vial line rated at 150–240 vials/minute, or a 4-head line rated at 80–120 vials/minute, as detailed in the technical specification tables for Harsiddh Unimach vial systems. Use the conservative end of the range for planning purposes, not the maximum.
2. Availability
Availability measures how much of the scheduled production time the machine is actually running, versus stopped for changeovers, breakdowns, cleaning, or planned maintenance.
Availability = Actual Run Time ÷ Planned Production Time
If a shift is scheduled for 8 hours (480 minutes) and the line is actually filling vials for 390 of those minutes — the rest lost to a format changeover, a stopper bowl refill, and two short mechanical stops — availability is:
390 ÷ 480 = 81.25%
Changeover time is one of the biggest availability drains on a vial line, particularly when switching between container sizes. Reducing that loss is exactly what SMED-based changeover engineering is built for — see our guide on vial filling machine changeover best practices for format-part strategies that shrink this window.
3. Performance Rate
Performance rate captures the gap between the machine’s rated cycle speed and the speed it actually runs at in production — including minor stops (jams, sensor holds, momentary stoppages) that are too short to log individually but add up across a shift.
Performance Rate = (Total Vials Produced ÷ Actual Run Time) ÷ Rated Speed
If the line is rated at 150 vials/minute but, across 390 minutes of run time, only 52,650 vials came off the outfeed, the actual running rate is 52,650 ÷ 390 = 135 vials/minute.
Performance Rate = 135 ÷ 150 = 90%
This is where dosing pump behavior, “no vial – no fill” sensor holds, and micro-jams at the indexing star wheel all show up in the math, even if no single stoppage was long enough to be logged as downtime.
4. Quality Rate (First-Pass Yield)
Quality rate accounts for vials that are filled but rejected — underweight or overweight doses, missing or misaligned stoppers, cracked flanges from crimping, or cosmetic defects caught at outfeed inspection.
Quality Rate = Good Vials ÷ Total Vials Produced
If 52,650 vials were produced and 51,600 passed inspection, quality rate is 51,600 ÷ 52,650 = 98%.
Putting It Together
Actual Output = 150 vpm × 0.8125 × 0.90 × 0.98 ≈ 107.5 vials/minute of good, sellable output — a full 28% below the 150 vpm nameplate figure, even though nothing on the line is “broken.” This is a completely normal, healthy result for a well-run line; the point of the calculation isn’t to chase 100% OEE, it’s to plan against a realistic number.
Calculating Batch Completion Time
Once you have a realistic actual-output figure, translating it into a batch schedule is straightforward:
Batch Time (minutes) = Batch Size (vials) ÷ Actual Output (vials/minute)
For a 500,000-vial batch running at an actual output of 107.5 vials/minute:
500,000 ÷ 107.5 ≈ 4,651 minutes ≈ 77.5 hours of scheduled production time — not the 500,000 ÷ 150 = 55.6 hours a nameplate-speed calculation would suggest.
That roughly 22-hour gap is exactly the kind of scheduling error that causes a plant to consistently miss delivery dates, overrun labor budgets, or under-forecast utility and cleanroom occupancy costs. Getting this number right at the planning stage is one of the highest-leverage things a production engineering team can do.
Factors That Move the Needle on Real Output
Container Size and Format
Smaller vials generally allow higher indexing speeds but tighter dosing tolerances; larger vials (50–100 mL) often run slower due to longer fill times per dose and increased headspace-gassing duration. Machines with tool-less, quick-release format parts reduce the performance-rate penalty when a facility runs multiple container sizes on the same line.
Product Viscosity and Foaming Characteristics
Highly viscous or foam-prone formulations often require slower nozzle withdrawal speeds and longer anti-drip suck-back timing, which directly reduces the achievable cycle rate below the rated maximum — a factor worth reviewing alongside dosing pump technology selection (volumetric piston vs. peristaltic) for your specific formulation.
Stoppering Method (Full vs. Half)
Half-stoppering for lyophilized products typically runs at a slightly reduced indexing speed compared to full stoppering, since seating depth and orientation checks require more precise timing.
Gassing Requirements
Products requiring pre- and post-gassing with nitrogen or CO2 add dwell time at those stations, which can reduce overall achievable speed compared to a non-gassed liquid fill — a tradeoff worth quantifying early in the capacity model rather than discovering it during validation runs.
Line Integration and Upstream/Downstream Bottlenecks
A vial filling machine rarely runs in isolation. If it’s integrated with a washing machine upstream or an inspection machine and labeling machine downstream, the actual line throughput is capped by whichever station has the lowest sustained output — not by the filler’s own rated speed. Capacity planning should always be done at the line level, not the individual-machine level.
A Practical Worksheet for Your Own Line
To calculate actual output for your own facility, track the following over a representative shift or batch run:
- Planned production time (scheduled shift length minus scheduled breaks)
- Actual run time (planned time minus all recorded stoppages — changeover, breakdown, cleaning, planned maintenance)
- Total vials produced (from the outfeed counter or batch record)
- Good vials (total produced minus rejects at inspection)
- Rated speed (from the machine’s technical datasheet, conservative end of range)
Plug those five numbers into the Availability × Performance × Quality formula above, and you’ll have a defensible, audit-ready actual-output figure — far more useful for scheduling, staffing, and delivery commitments than the number on the brochure.
How Machine Design Affects Your Real-World Numbers
Not all vial filling machines lose the same amount of ground between rated speed and actual output. The design choices that most directly protect real-world throughput include:
- Tool-less changeover parts that cut format-switch downtime, directly improving the availability term
- Servo-driven dosing and indexing (rather than purely mechanical cam-driven systems), which reduces micro-stop frequency and improves the performance-rate term
- Reliable “no vial – no fill” and anti-drip suck-back systems, which reduce both minor stoppages and quality rejects simultaneously
- Robust, pressure-regulated crimping that minimizes glass flange cracking, protecting the quality-rate term
These are the same engineering priorities behind every Harsiddh Unimach Pvt. Ltd. vial filling, stoppering, and crimping line — built with full cGMP architecture, 21 CFR Part 11–compliant PLC/HMI controls, and mirror-polished AISI 316L product-contact parts, and backed by complete FAT/DQ/IQ/OQ documentation to support validation and regulatory approval.
If your current line’s actual output has drifted well below its rated speed, or you’re sizing a new injectable liquid vial filling line for an upcoming project, our engineering team can walk through a capacity model specific to your formulation, container range, and batch sizes.
Get a Tailored Capacity Assessment
Understanding the real throughput of your vial line — not just its rated speed — is the foundation of accurate production planning, staffing, and delivery commitments. Explore our full range of vial filling machines and related injectable ampoule filling lines, read more on our blog, or reach out directly to our technical team at info@harsiddhunimach.com or via www.harsiddhunimach.com for a capacity assessment tailored to your product and container specifications.