
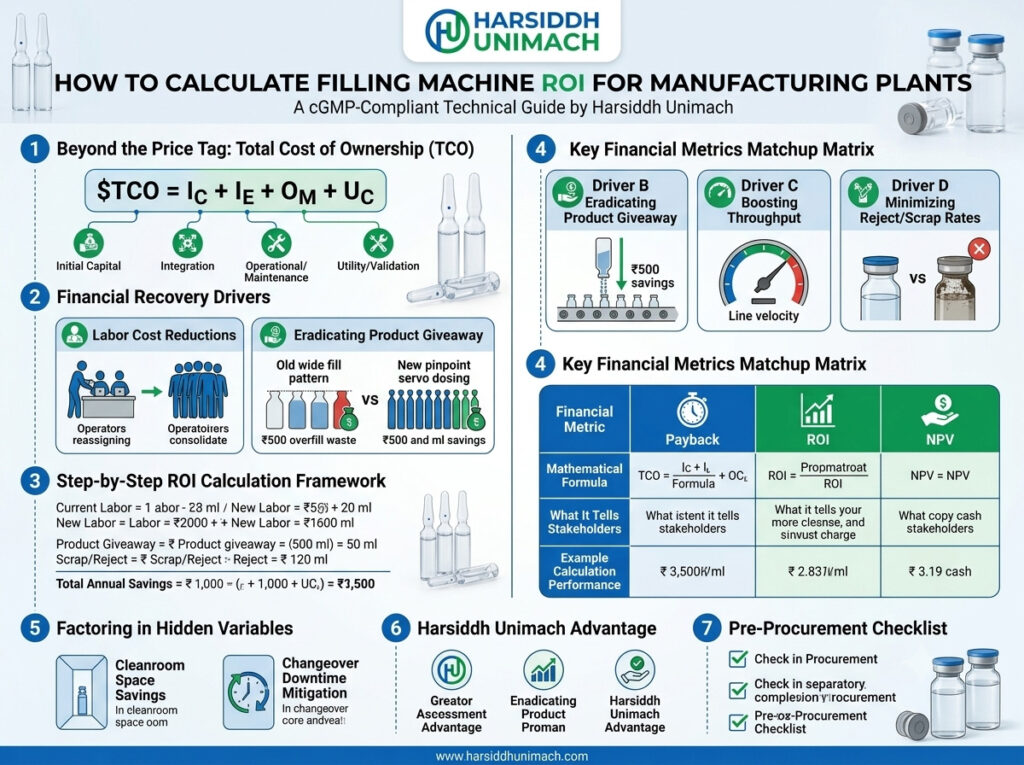
Buying a new filling machine is a significant capital investment. Whether you are upgrading from manual filling, replacing a semi-automatic machine or adding a complete automatic line, management will ask the same question: “When will this pay for itself?”
Answering that question well requires more than comparing the machine price with labour savings. A good filling machine affects product giveaway, reject rates, output, changeover time, quality, compliance and utility costs. Some of these benefits are obvious; others are hidden but often larger.
In this guide, we explain how to calculate filling machine ROI step by step, which costs and benefits to include, how to calculate payback period and net present value, and how to avoid common mistakes. We finish with a complete worked example you can adapt for your own plant.
What Is Filling Machine ROI?
Return on investment (ROI) measures how much financial benefit an investment generates compared with its cost. For a filling machine, it answers whether the money saved and earned through the machine justifies its purchase.
Three measures are commonly used together:
- Simple ROI (%) = Net annual benefit ÷ Total investment × 100
- Payback period = Total investment ÷ Net annual benefit
- Net present value (NPV) = Present value of future net benefits − Total investment
Simple ROI and payback period are easy to understand and communicate. NPV takes the time value of money into account and is preferred by finance teams for larger investments.
Step 1: Calculate the Total Investment
Start by capturing every cost involved in getting the machine running, not just the purchase price:
- Machine price, including change parts for all container sizes
- Freight, insurance and taxes
- Installation and commissioning
- Utilities and site preparation: electrical supply, compressed air, nitrogen, water and drainage
- Validation: FAT, SAT, IQ, OQ and PQ — especially important in pharmaceutical plants
- Operator and maintenance training
- Initial spare parts
- Integration costs: conveyors, buffer tables and controls to link with existing equipment
Missing these items makes ROI look better on paper than it will be in reality.
Step 2: Identify Labour Savings
Labour savings are usually the first benefit considered. Compare the number of operators needed per shift with the current process and the new machine:
Annual labour saving = Operators saved × Annual cost per operator
Include wages, benefits and overheads in the cost per operator. Be realistic: automatic machines still need skilled operators for setup, monitoring, changeovers and quality checks. The saving comes from fewer people per line, not none.
In many plants, the bigger benefit is not reducing headcount but redeploying skilled staff to other work while increasing output.
Step 3: Quantify Product Giveaway Reduction
Product giveaway — overfilling containers above their declared volume — is one of the most overlooked costs in filling. Manual and older machines often require higher fill targets to ensure no container is underfilled. A modern servo or load cell filler can safely run much closer to the target.
Annual giveaway saving = Units per year × Overfill reduction per unit × Product cost per unit volume
Even a small reduction per container becomes significant at high volumes. Precise technologies such as the servo based piston filling machine and the load cell based liquid filling machine are designed to minimise this loss.
Step 4: Calculate Reject and Waste Savings
Rejected containers waste product, containers, caps, labels and labour. Underfills, spills, poor capping and damaged containers all add to the total.
Annual reject saving = Units per year × Reduction in reject rate × Cost per rejected unit
Include the full cost of each rejected unit — product, packaging and any rework or disposal costs.
Step 5: Value Increased Output
A faster, more reliable machine produces more good units in the same time. If you can sell the additional output, its value is the contribution margin — selling price minus variable costs — on the extra units.
Annual output benefit = Additional units sold × Contribution margin per unit
Base the calculation on actual output, not the machine’s rated speed. Actual output depends on changeovers, cleaning, breakdowns and minor stops. Our article on how to calculate actual vial filling line output explains how to estimate realistic production rates, and our guide to common causes of downtime in pharmaceutical filling lines shows where output is often lost.
If you cannot sell the additional output, the benefit may instead appear as reduced overtime, fewer shifts or delayed investment in another line.
Step 6: Include Changeover and Downtime Savings
Servo machines with stored recipes and tool-less change parts can reduce changeover time significantly. For plants running many products or container sizes, this adds productive hours every week.
Annual changeover benefit = Changeovers per year × Time saved per changeover × Value of one production hour
Similarly, a more reliable machine reduces unplanned downtime, which can be valued in the same way.
Step 7: Account for Additional Operating Costs
A new machine may add some costs:
- Maintenance and spare parts
- Energy and compressed air
- Consumables such as peristaltic tubing
- Annual service contracts or calibration
Subtract these from the total annual benefits to arrive at the net annual benefit.
Step 8: Consider Quality and Compliance Benefits
Some benefits are harder to quantify but still important:
- Lower risk of recalls from underfilled or contaminated products
- Better data and documentation for audits
- Improved product presentation with consistent fill levels
- Safer working conditions with less manual handling
- Ability to win new customers who require automated, compliant production
Even if they are not included in the numbers, list these benefits alongside the ROI calculation so decision-makers see the full picture.
Step 9: Calculate Payback, ROI and NPV
With total investment and net annual benefit established, calculate:
- Payback period in years (or months)
- Simple annual ROI as a percentage
- NPV over the expected life of the investment, using your company’s discount rate
A shorter payback and positive NPV indicate a strong investment.
Worked Example: Upgrading to an Automatic Servo Filler
A manufacturer currently fills 100 ml syrup bottles on semi-automatic equipment and is considering an automatic servo-driven filling and capping line. Annual production is 50,00,000 bottles (5 million).
All figures below are illustrative. Replace them with your own plant data.
Total investment
| Item | Amount (₹) |
|---|---|
| Machine with change parts | 30,00,000 |
| Installation, commissioning and validation | 3,00,000 |
| Training | 50,000 |
| Total investment | 33,50,000 |
Annual benefits
| Benefit | Calculation | Amount (₹) |
|---|---|---|
| Labour saving | 4 operators × ₹2,40,000 | 9,60,000 |
| Giveaway reduction | 50,00,000 bottles × 2 ml saved = 10,000 L × ₹60/L | 6,00,000 |
| Reject reduction | Reject rate down 1.5% = 75,000 bottles × ₹8 | 6,00,000 |
| Additional output contribution | Extra sales margin | 5,00,000 |
| Total annual benefit | 26,60,000 |
Additional annual costs
| Cost | Amount (₹) |
|---|---|
| Maintenance and spares | 1,50,000 |
| Additional power and compressed air | 60,000 |
| Total additional cost | 2,10,000 |
Results
- Net annual benefit: ₹26,60,000 − ₹2,10,000 = ₹24,50,000
- Payback period: ₹33,50,000 ÷ ₹24,50,000 = 1.37 years (about 16 months)
- Simple annual ROI: ₹24,50,000 ÷ ₹33,50,000 = 73%
- 5-year ROI: (₹24,50,000 × 5 − ₹33,50,000) ÷ ₹33,50,000 = 266%
- NPV over 5 years at 12% discount rate: approximately ₹54.8 lakh
In this example, giveaway and reject savings together contribute almost as much as labour savings — a typical pattern that many ROI calculations miss.
Test Your Assumptions: Sensitivity Analysis
Every ROI calculation rests on assumptions, so it is worth asking, “What if we are wrong?” A simple sensitivity analysis recalculates the payback period under less favourable conditions:
- Conservative case: remove the additional output contribution (₹5,00,000). Net annual benefit falls to ₹19,50,000 and payback rises to about 1.7 years — still a strong investment.
- Lower volume case: if production is 20% lower, giveaway and reject savings fall proportionally, but labour savings remain.
- Higher cost case: if installation and validation cost more than expected, payback extends by only a few weeks.
If the investment still looks attractive under conservative assumptions, decision-makers can approve it with confidence.
Data You Need to Collect Before Calculating
Accurate ROI depends on accurate inputs. Before you start, gather:
- Current and forecast annual production volumes for each product
- Current fill weights from sample checks, to measure actual overfill
- Reject rates by cause over recent months
- Number of operators per shift and fully loaded labour cost
- Number and duration of changeovers per month
- Downtime records and their causes
- Product cost per litre or kilogram and packaging cost per unit
- Contribution margin per unit for products where extra output can be sold
Collecting this data often reveals improvement opportunities on its own — and gives suppliers what they need to propose the right machine.
Choosing Equipment With ROI in Mind
The machine you choose has a direct effect on ROI:
- Accuracy: precise dosing reduces giveaway — consider servo fillers such as the Automatic Servo Based Liquid Filling Machine or a volumetric bottle liquid filler.
- Integration: combining operations saves labour and space — for example, the Automatic Liquid Bottle Filling and Capping Machine (Monoblock).
- Downstream balance: capping must keep pace with filling. Options include the Automatic Four Head Pick and Place Type Screw Capping Machine, our linear capping machine and the wider range of capping machines.
- Complete lines: for injectables or dry syrups, integrated systems such as the Automatic Liquid Vial Filling Line (Compact Line) or an automatic dry syrup powder filling line reduce transfers, labour and floor space.
For vial users weighing up automation levels, our automatic vs semi-automatic vial fillers ROI analysis offers a focused comparison, and you can explore our vial filling machines for liquid vials.
Common ROI Calculation Mistakes
- Using rated speed instead of actual output. Real output is always lower; use realistic efficiency.
- Ignoring hidden benefits. Giveaway, rejects and changeover savings are often larger than expected.
- Leaving out installation and validation costs. These can add a meaningful percentage to the investment.
- Assuming all extra output can be sold. Only count additional sales if demand exists.
- Comparing purchase price only. A cheaper machine with higher giveaway or downtime can deliver a worse return.
- Forgetting the machine’s lifespan. Quality equipment can operate for many years; NPV over its life often shows its true value.
For more ideas on keeping investment efficient, see our article on cost-effective solutions for pharmaceutical and cosmetic packaging machinery.
How Harsiddh Unimach Can Help
Harsiddh Unimach Pvt. Ltd. designs and manufactures filling, capping, sealing and labelling machines for pharmaceutical, cosmetic, food and chemical manufacturers. Our team can help you estimate realistic output, accuracy and savings for your specific products, so you can build a reliable business case. Explore our liquid filling machines, the liquid filling machines on Harsiddh Engineering, or learn more about Harsiddh Engineering.
Frequently Asked Questions
What is a good payback period for a filling machine? Many manufacturers look for a payback period of one to three years, but the acceptable period depends on company policy, the machine’s lifespan and strategic benefits.
What benefits should be included in filling machine ROI? Labour savings, reduced product giveaway, fewer rejects, increased output, faster changeovers and reduced downtime, minus additional operating costs.
Why is product giveaway important in ROI? Overfilling gives product away free on every container. At high volumes, reducing overfill even slightly can save more than the labour reduction.
Should I use rated speed or actual output for ROI? Always use actual expected output, which accounts for changeovers, cleaning, breakdowns and minor stops.
What is NPV and why does it matter? Net present value converts future savings into today’s money using a discount rate. A positive NPV means the investment creates value over its life.
Want help building the business case for your next filling machine? Contact our team or send an inquiry to discuss your requirements.